Free! Easy, simple, fast, secure.
No additional conditions or fees.
Highest rebate rate : 100% of our IB commissions.
Auto Rebate : Directly to your trading account.
Direct Discount : Spread or commission reduction.
Popular and highly trusted forex brokers
For over 8 years, we have been providing our services.
Forex Auto Rebate / Forex Auto Cashback
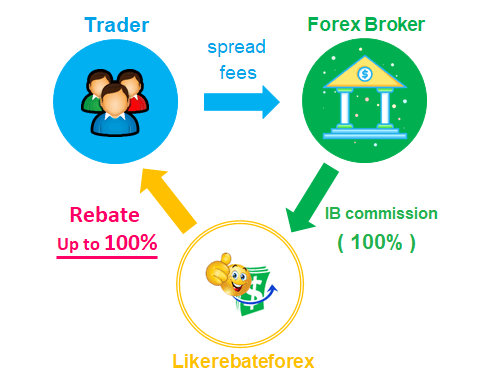
How does it work ?
After you open a forex trading account through our link, the forex broker will pay us the IB commission on every trade you make, regardless of whether you profit or incur a loss. We then return this IB commission to you as "Rebate/Cashback" which can be used to lower your forex trading costs and increase profits. All rebates are deposited directly into your trading account. "The more you trade, the more rebate you will get."
We give you back "up to 100%" of our IB commission.